In my last post, I showed how client-side .promise() with Promise.all gives you a genuine 4.4x speedup by running browser HTTP requests in parallel. Real concurrency, real performance win.
I assumed server-side async worked the same way. My early benchmarks backed that up. A User Event script showed 901ms down to 221ms. A Scheduled Script showed 433ms down to 178ms. The numbers looked great. I almost published them.
Then I started digging deeper, and the story fell apart.
The initial benchmarks
Here is the User Event benchmark that started everything. Five search.lookupFields calls on sales orders, sync vs async, running in afterSubmit:
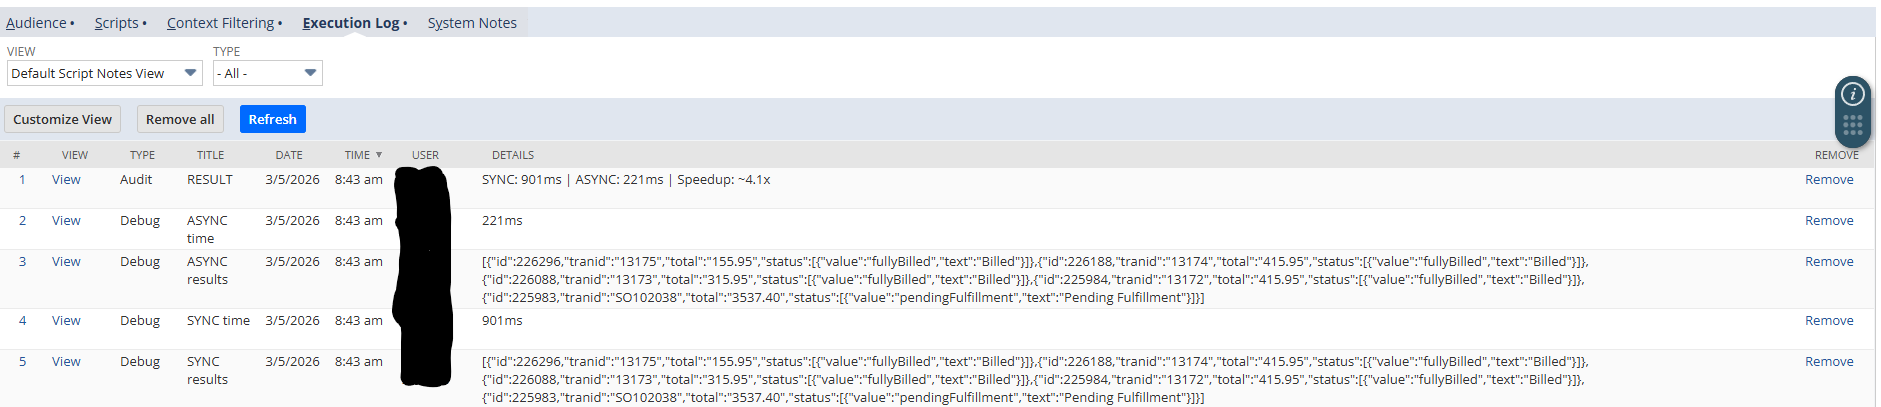
901ms down to 221ms. 4.1x. I ran it again on a Scheduled Script with timestamped logs proving the calls overlapped in time. All five launched within 20ms of each other. All five resolved in a tight cluster. The governance cost was identical: 5 units both ways.
Everything pointed to real concurrency. So I started writing the blog post.
Something didn't add up
Before publishing, I wanted to test at larger batch sizes. I wrote a script that dynamically found the last 50 sales orders and ran the same sync vs async comparison.
The results:
Batch size: 50 sales orders
Sync:  401ms  |  50 governance units  |  8ms avg per call
Async: 563ms  |  50 governance units  |  11ms effective avg

Speedup: 0.7x ... sync wins.
Async was slower. Not by a little. By 40%.
I switched to purchase orders to rule out caching. Same result. Sync: 285ms. Async: 545ms. Sync won again at 0.5x.
Something was fundamentally different between the 5-record test and the 50-record test. The per-call latency had dropped from ~80-180ms to ~6-8ms. And at those speeds, async couldn't keep up.
Building the forensic script
I needed to understand what was actually happening inside the async execution. Not just total time, but the exact timing of every individual call: when it launched, when it resolved, and in what order.
The forensic script tracked three things for each .promise() call:
- Launch index - the order they were fired
- Resolve index - the order they came back
- Timestamps - exact millisecond for both launch and resolve
With that data, I could answer the real question: are these calls actually running at the same time?
The answer: no
Here is what 25 async search.lookupFields.promise() calls look like when you measure the gaps between each resolve:
Gaps: [11, 10, 11, 10, 11, 11, 10, 11, 11, 10, 11, 11, 10, 11, 11, 10, 11, 11, 10, 11, 11, 10, 11, 11]

Avg gap: 10.7ms
Std deviation: 0.5ms
Every single result came back exactly ~10.5ms after the previous one. Like clockwork. The standard deviation across 24 gaps was half a millisecond.
If these calls were running in parallel and hitting the database independently, the gaps would be noisy. Different records have different complexity. Different queries can hit different table partitions. You would see variation. Instead, the timing is perfectly uniform.
But the timing alone doesn't prove serial execution. A single-threaded event loop collecting results from a parallel backend could theoretically produce uniform gaps too, if the JS thread were polling on a fixed interval. What rules that out is the total wall-clock time. If work were overlapping in the background, async total time should be significantly less than sync. Instead, async took longer (563ms vs 401ms at 50 records). The Promise machinery overhead would have to eat all the parallelism gains and then some. Combined with the uniform gaps, the most consistent explanation is serial execution.
The resolve order added another data point. Out of 25 calls, only 5 resolved in the same position they were launched. The engine was reordering them internally (probably some kind of query optimization), but processing them sequentially regardless.
Testing across modules
Maybe this was just an N/search thing. I ran the same forensic analysis on N/query using SuiteQL:
Gaps: [0, 0, 0, 0, 0, 0, 0, 0, 0, 0, 0, 0, 0, 0]
Std deviation: 0.0ms
Resolve order: L0,L1,L2,L3,L4,L5,L6,L7,L8,L9,L10,L11,L12,L13,L14

Sync:  425ms  |  Async: 234ms  |  1.82x async "wins"
But: first sync call was 176ms, rest averaged 17.8ms
The gaps were all zeros. The resolve order was perfectly sequential, exactly matching the launch order. And the async "speedup" was entirely explained by the first sync call taking 176ms (a cold-start penalty for the first time the script touched N/query) while the rest averaged 17ms.
Async didn't win because of parallelism. It won because the cold-start cost of the first call got overlapped with launching the remaining calls. More on why that distinction matters below.
The big test: N/https
This was the one that could have saved the server-side async story. N/search and N/query are database operations that stay inside NetSuite's server. But https.requestSuitelet.promise() makes actual HTTP calls. Real network I/O that leaves the server and comes back. If anything was going to show true parallelism, this would be it.
I set up a simple ping Suitelet that responds immediately with a JSON timestamp. Then I called it 10 times, sync and async, from a Scheduled Script:
Sync:  1830ms  |  Per-call: [427, 140, 168, 148, 198, 147, 133, 155, 130, 184]
Async: 2096ms  |  Gaps: [0, 0, 0, 0, 0, 0, 0, 0, 0]

Std deviation: 0.0ms
Resolve order: L0,L1,L2,L3,L4,L5,L6,L7,L8,L9
Wait times: [2096, 1870, 1670, 1526, 1053, 809, 662, 489, 335, 141]

Speedup: 0.87x ... sync wins.
Serial. Even for HTTP.
Look at those wait times. The first call launched had to wait 2,096ms because every other call was processed ahead of it in a serial queue. The last call launched only waited 141ms because it was at the end of the line with nothing behind it. That's a textbook serial queue draining pattern.
One caveat on this test: these are intra-NetSuite calls. A Scheduled Script calling a Suitelet stays inside the NetSuite infrastructure, and it's possible that NetSuite applies internal request routing or session-level throttling that wouldn't apply to calls to external endpoints. I wasn't able to test https.get.promise() against an external service due to production account restrictions. If someone can run that test, the results would be valuable. That said, the wait-time staircase pattern here is consistent with everything else we observed, and if NetSuite were dispatching HTTP calls to a thread pool, you'd expect the total async time to beat sync even with internal routing. It didn't.
Going back to the original benchmark
If server-side async is serial, why did my original 5-record benchmarks show a 2-4x speedup?
I ran the forensic script against those exact five record IDs (226296, 226188, 226088, 225984, 225983) on both a Scheduled Script and a User Event.
Scheduled Script:
Sync cold:  38ms  |  Per-call: [8, 6, 8, 7, 8]
Sync warm:  38ms  |  Per-call: [8, 8, 8, 7, 7]
Async cold: 153ms
Async warm: 55ms

Sync wins both cold and warm.
No speedup. Per-call latency was 6-8ms. When the individual calls are that fast, async overhead makes it slower, not faster.
User Event (afterSubmit):
Sync:  850ms  |  Per-call: [821, 11, 6, 6, 6]
Async: 120ms  |  7.08x async "wins"

Async gap std deviation: 22.1ms (VARIABLE, not uniform)
There it is. The first sync call on the User Event took 821ms. The remaining four took 6-11ms each.
The cold-start question
I attributed that 821ms to the execution context spinning up its database connection. Honestly, I can't say for certain what all is included in that cost. It could be some combination of Graal JIT compilation of the script, Java classloading for the N/search module, connection pool acquisition, record metadata cache warming, or other internal initialization. I don't have JVM-level instrumentation to break it down.
What I can say is that it happens consistently on the first API call in a fresh User Event context. Every afterSubmit trigger creates a new server-side execution context, so this penalty hits on every record save.
The async version overlaps that cold-start cost with launching the other four calls. By the time the slow first call finishes, the fast ones are already queued and some have already resolved. The result looks like a 7x speedup.
Now, is that "real" parallelism? No. The operations still execute serially. But here's the thing: if you're writing User Event scripts that make multiple API calls, the cold-start overlap is a real-world performance benefit. On every record save, async can absorb that ~800ms initialization cost into the first call while the remaining calls queue up behind it. That's not a measurement artifact. That's 700ms your users aren't waiting for.
The key is understanding why it's faster so you can predict when the benefit applies. It works when: (a) you're in a User Event with a cold execution context, and (b) you're making multiple calls where the first one absorbs the initialization penalty. It does not mean your calls are running in parallel, and the benefit disappears on warm contexts. Run it again immediately after, and the gaps go right back to uniform ~10.5ms. Serial.
What is actually happening under the hood
SuiteScript 2.1 server scripts run on Graal.js, the JavaScript engine from Oracle's GraalVM. NetSuite migrated from Rhino to GraalVM starting with the 2019.2 release. Graal.js is a modern, high-performance engine that supports ECMAScript 2023 features, including async/await and Promises natively.
So the engine can handle async. Based on the behavioral evidence from these tests, the limitation appears to be in NetSuite's API layer, the Java-based backend that sits between your SuiteScript code and the actual database or HTTP operations.
When you call search.lookupFields.promise(), the Graal.js engine creates a real JavaScript Promise. But based on the timing data, the underlying Java method that executes the database lookup appears to be called synchronously on the same thread. The .promise() wrapper gives you Promise semantics (async/await syntax, .then() chaining, Promise.all composition) without changing how the work is actually executed.
I want to be clear: I don't have access to NetSuite's server source code. This is my best interpretation of the observed behavior, not a statement about their implementation. What I can say is that every test I ran is consistent with serial execution and inconsistent with parallel execution.
The evidence across our testing:
- N/search: Serial. Gaps of 10.5ms ± 0.5ms. Async slower than sync at scale.
- N/query: Serial. Gaps of 0ms. Resolve order perfectly matches launch order.
- N/https: Serial. Intra-NetSuite HTTP calls processed one at a time with a textbook queue-drain pattern.
- Scheduled Script: Serial across all modules.
- User Event: Serial across all modules. Cold-start overlap produces a real but non-parallelism-based speedup.
- Governance: Identical cost, sync or async.
What server-side .promise() is actually good for
It's not a parallelism tool. But it's not useless either.
Cold-start overlap in User Events. As shown above, if your afterSubmit or beforeSubmit makes multiple API calls, wrapping them in Promise.all can absorb the execution context initialization cost into the first call. This is a real performance win that applies on every record save. It's not parallelism, but the end result is the same: your users wait less.
Code readability. async/await is genuinely cleaner than nested callbacks or deeply chained .then() blocks. If you are writing complex server-side logic with multiple sequential operations, async syntax makes the code more readable and easier to maintain.
Structured error handling. Promise.allSettled gives you per-operation status for batch operations. Instead of wrapping a for-loop in try/catch and losing context on which iteration failed, you get fulfilled or rejected for each call.
Future-proofing. If Oracle ever updates the API layer to support true concurrent execution on the server, your code is already written for it.
Practical recommendations
Rather than a blanket "sync is faster," here is when to use each approach:
Use async Promise.all in User Event scripts that make multiple API calls. The cold-start overlap is a real win that applies on every trigger.
Use sync in Scheduled Scripts and Map/Reduce scripts for batch operations, especially at higher volumes (20+ calls). The Promise overhead adds up and you get no parallelism benefit to offset it.
Use whichever you prefer for small batch sizes (under 10 calls) in Scheduled Scripts. The performance difference is negligible either way, so optimize for readability.
Don't rewrite existing sync code to async expecting a server-side performance improvement. The data does not support that.
What I didn't test
Two gaps worth noting:
External HTTP calls. All my N/https testing used intra-NetSuite Suitelet calls. It's possible that https.get.promise() or https.post.promise() to external endpoints behaves differently, since NetSuite wouldn't have internal routing or session-level constraints to apply. If you can test this on your account, I'd like to see the results.
Map/Reduce scripts. Map/Reduce already has built-in parallelism through its stage architecture — multiple map or reduce invocations can run concurrently across SuiteCloud Processors. I didn't test whether .promise() within a single map or reduce function behaves differently than in a Scheduled Script. Given that the limitation appears to be at the API layer rather than the script type, my expectation is that it's the same, but I haven't confirmed it.
Caveats
This testing was done on a single production account running NetSuite 2025.2 with 2 SuiteCloud Processors. Each test scenario was run a limited number of times due to production account constraints. I can't guarantee every account on every version behaves identically, and I'd like to see these results reproduced on other accounts, particularly accounts with higher SuiteCloud Processor counts. Oracle could change the server-side implementation in a future release.
What I can say is that across six different test configurations, three different modules, two script types, and multiple batch sizes from 5 to 50, the pattern was consistent and reproducible. The forensic scripts are available below if you want to run them on your own account.
The full picture
Client-side async in SuiteScript 2.1 is a real, proven performance optimization. The browser runs .promise() calls in true parallel using V8's event loop. Use it anywhere your client scripts make multiple independent requests.
Server-side async is primarily a code organization tool, with one notable exception: User Event cold-start overlap provides a genuine performance benefit. Beyond that, the .promise() API gives you modern JavaScript syntax and structured error handling. It does not give you parallel execution. The underlying operations run serially regardless of whether you use sync or async.
If you saw benchmarks showing 2-4x server-side speedups, look at the first call. That is where the "speedup" lives. In User Events, that speedup is real and worth using. In Scheduled Scripts on a warm context, it disappears.
Reproduce it yourself
I have published the full forensic benchmark scripts on my GitHub. Deploy them on your account and see if your results match. If they don't, I want to hear about it.
- Scheduled Script forensic suite - Tests N/search, N/query, N/https across multiple batch sizes
- User Event forensic script - Confirms the pattern on afterSubmit
- Ping Suitelet - Required for the N/https test
Need help with your SuiteScript?
I write production SuiteScript for businesses that need NetSuite to work well. If your scripts need optimization or your customizations need a rewrite, let's talk.